2QFY2016 Result Update | Amusement Parks
October 28, 2015
Wonderla Holidays
NEUTRAL
CMP
`316
Performance Highlights
Target Price
-
Quarterly Data
Investment Period
12 months
(` cr)
2QFY16
2QFY15
% yoy
1QFY15
% qoq
Revenue
43
34
25.9
67
(35.7)
Stock Info
EBITDA
15
11
36.6
40
(63.5)
Sector
Amusement Parks
Margin (%)
34.0
31.4
265bp
59.9
(2,591bp)
Market Cap (` cr)
1,765
Reported PAT
12
6
85.5
28
(57.4)
Source: Company, Angel Research
Net Debt (` cr)
(187)
Beta
1.0
Wonderla Holidays’ 2QFY2016 results have come in ahead of our expectations.
52 Week High / Low
349 / 242
The top-line growth was strong due to healthy growth in footfalls and increase in
Avg. Daily Volume
23,866
average realization. Further, a favorable operating performance led to a higher PAT
Face Value (`)
10
growth for the quarter.
BSE Sensex
27,253
Strong top-line performance, led by healthy growth in footfalls: The company’s
Nifty
8,233
top-line for the quarter grew by a healthy ~26% yoy to `43cr, mainly due to
Reuters Code
NA
healthy growth in footfalls. Overall park footfalls grew by 7% yoy. An increase in
Bloomberg Code
WONH@IN
average realization also contributed to the revenue growth.
Higher PAT on back of strong operating performance: The company reported a
robust PAT growth of ~86% yoy to `12cr, on the back of strong top-line and
Shareholding Pattern (%)
operating performance. The operating performance was aided by lower
Promoters
71.0
advertising and marketing expenses, which declined by 19% yoy. This expense
MF / Banks / Indian Fls
3.3
head benefitted from the base effect as the festival season (when promotional
FII / NRIs / OCBs
9.1
expenses tend to be higher) falls in the third quarter this year while it fell in the
Indian Public / Others
16.5
later part of the second quarter last year. Lower other expenditure also
contributed towards better margins, during the quarter.
Outlook and valuation: India’s young demographic profile and increasing
Abs. (%)
3m 1yr
3yr
discretionary spends are expected to benefit the entertainment industry in the
Sensex
(4.1)
1.9
46.3
country. Also, the addition of a new park in the company’s portfolio and expected
Wonderla
21.1
(0.4)
NA
increase in contribution from other segments like F&B, resort, etc will drive growth
for the company, going forward. Further, the company has negative working
capital and negligible debt on its balance sheet. However, we believe that with the
3-year price chart
recent up move in the stock, all the positives have been captured. Hence, we
390
recommend a Neutral rating on stock.
340
290
Key financials (Consolidated)
Y/E March (` cr)
FY2014
FY2015
FY2016E
FY2017E
240
Net Sales
190
154
182
208
311
% chg
140
11.4
18.4
14.6
49.2
Net Profit (Adj.)
40
51
60
73
% chg
18.8
27.0
17.8
22.1
Source: Company, Angel Research
EBITDA margin (%)
46.0
44.3
44.0
43.6
EPS (`)
7.1
9.0
10.6
12.9
P/E (x)
44.6
35.1
29.8
24.4
P/BV (x)
11.9
5.0
4.7
4.3
RoE (%)
26.6
14.2
15.7
17.5
RoCE (%)
33.1
17.3
18.8
24.3
Amarjeet S Maurya
EV/Sales (x)
11.6
8.8
8.4
5.6
022-39357800 Ext: 6831
EV/EBITDA (x)
25.2
19.8
19.2
12.9
Source: Company, Angel Research; Note: CMP as of October 27, 2015
Please refer to important disclosures at the end of this report
1
Wonderla Holidays | 2QFY2016 Result Update
Exhibit 1: Quarterly performance
Y/E March (` cr)
2QFY16
2QFY15
% yoy
1QFY16
% qoq
FY2015
FY2014
% chg
Net Sales
43
34
25.9
67
(35.7)
182
154
18.4
Consumption of RM
12
2
463.3
4
196.4
11
9
18.7
(% of Sales)
27.5
6.1
6.0
6.2
6.1
Staff Costs
8
7
9.5
7
5.5
27
25
7.1
(% of Sales)
17.5
20.1
10.7
14.9
16.5
Ad. & Marketing Expenses
3.51
4.32
(18.9)
5
(26.4)
18
17
7.8
(% of Sales)
8.1
12.6
7.1
9.8
10.8
Operating Expense
5.6
10
11.0
45
32
(% of Sales)
12.9
29.7
16.3
24.9
20.9
Total Expenditure
29
24
21.1
27
5.9
101
83
21.6
Operating Profit
15
11
36.6
40
(63.5)
81
70
14.5
OPM (%)
34.0
31.4
59.9
44.3
45.8
Interest
0
0
(1.6)
0
(4.2)
2
2
Depreciation
4
4
(5.2)
4
(10.6)
16
13
22.7
Other Income
6
3
98.1
7
(24.9)
10
2
325.3
PBT
16
9
76.4
43
(62.7)
73
58
26.0
Ext Income/(Expense)
-
0.0
-
-
PBT (incl. Ext Items)
16.0
9
43.0
73
58
(% of Sales)
37.0
26.4
63.9
40.1
37.7
Provision for Taxation
4
3
54.1
15
(72.8)
22
18
23.8
(% of PBT)
25.3
29.0
34.7
30.6
31.1
Minority Interest
0
0
Recurring PAT
12
6
85.5
28
(57.4)
51
40
26.9
PATM
27.6
18.8
41.7
27.8
26.0
Exceptional items
Reported PAT
12
6
85.5
28
(57.4)
51
40
26.9
Equity shares (cr)
5.7
5.7
5.7
5.7
5.7
FDEPS (`)
2.1
1.1
85.5
5.0
(57.4)
9.0
7.1
26.9
Source: Company, Angel Research
October 28, 2015
2
Wonderla Holidays | 2QFY2016 Result Update
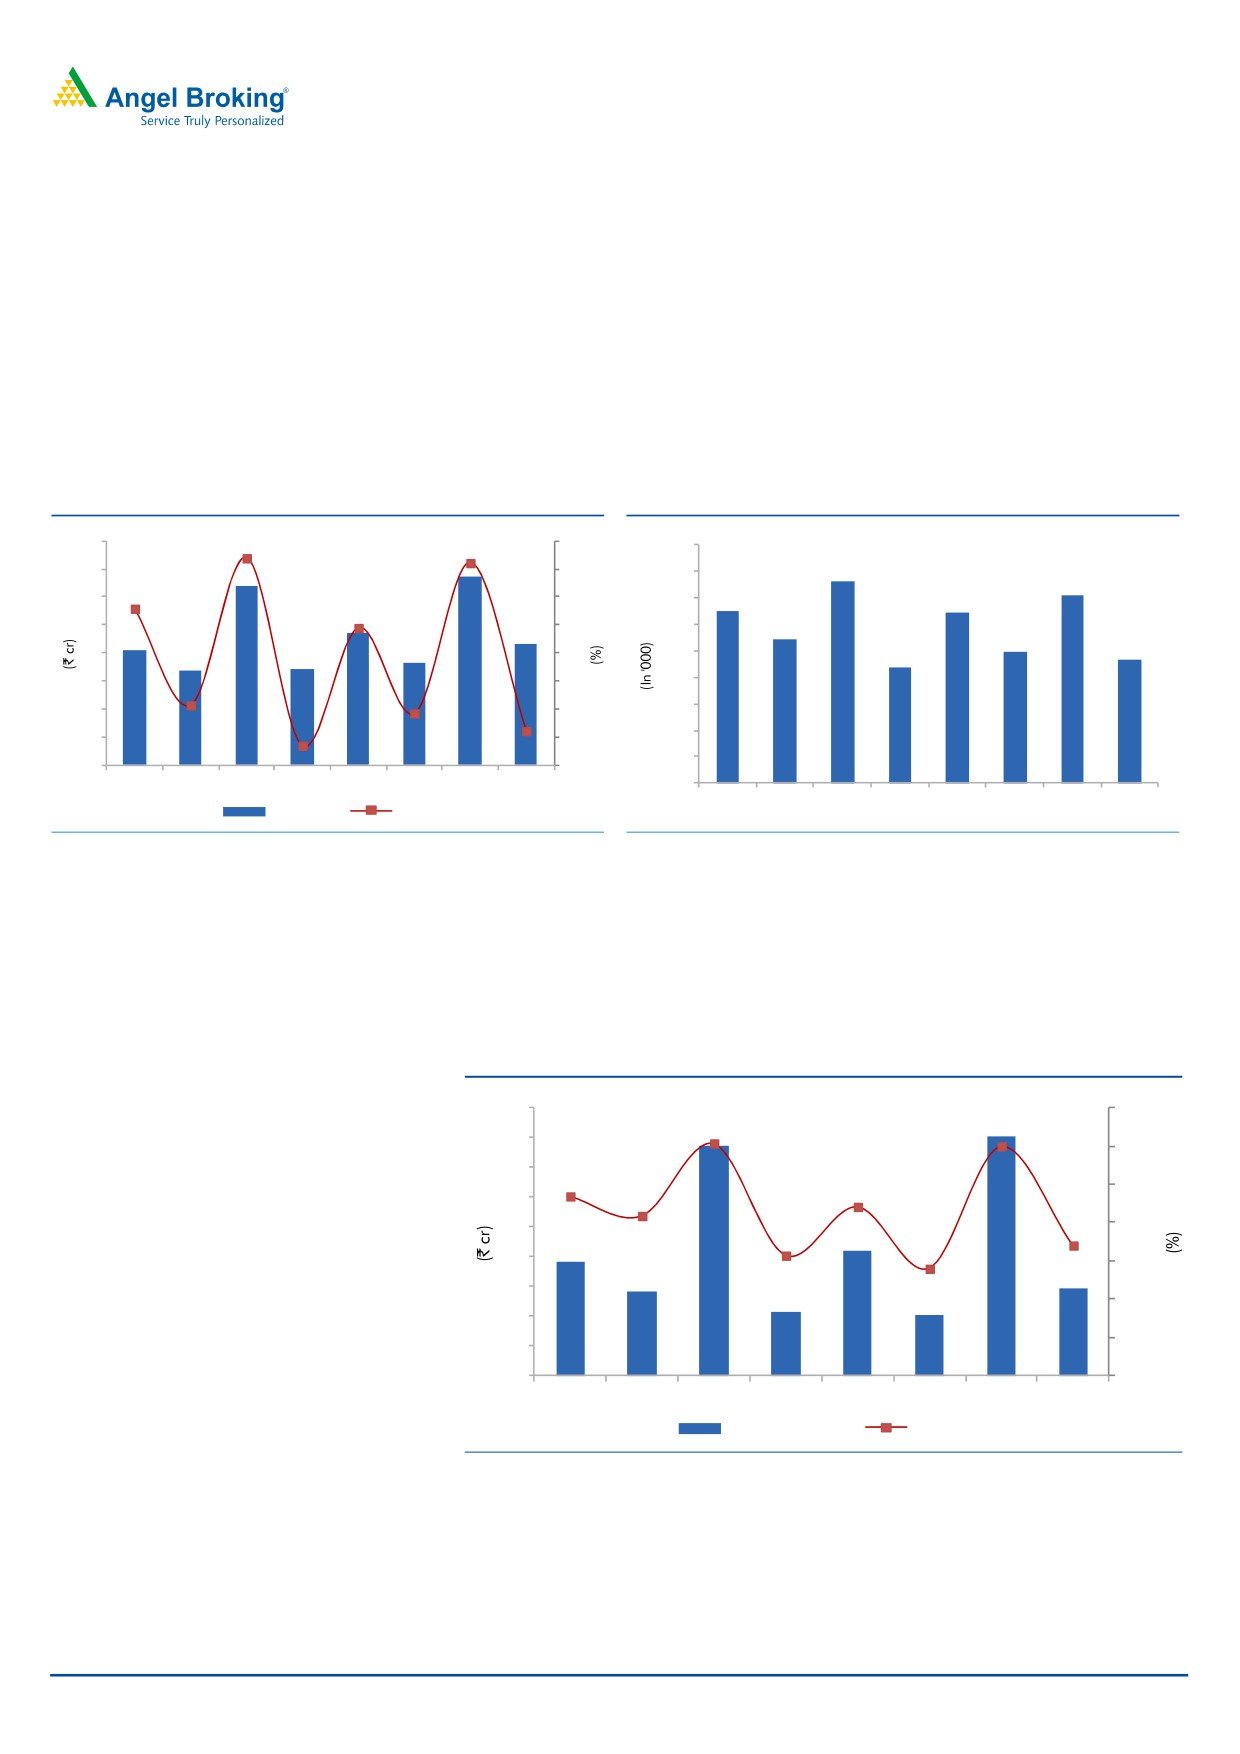
Strong top-line performance, led by healthy growth in footfalls
The company’s top-line for the quarter grew by a healthy ~26% yoy to `43cr (vs
our estimate of `38cr), mainly due to healthy growth in footfalls. Overall park
footfalls grew by 7% yoy. An increase in average realization also contributed to the
revenue growth. During the quarter, the Bangalore Park witnessed ~12% yoy
growth in average ticket revenue and ~21% yoy growth in average non-ticket
revenue. Footfalls at the Bangalore Park grew by ~4% yoy. Further, the Kochi park
witnessed a ~21% increase in average ticket revenue, ~35% yoy increase in
average non-ticket revenue, and ~4% yoy increase in footfalls.
-line growth trend
l Footfalls trend
80
100
900
87.8
84.3
764
70
80
800
706
60
60
700
649
641
51.8
50
40
600
541
38.0
499
469.2
40
20
500
436.9
30
0
400
20
(17.3)
-20
300
(23.0)
200
10
-40
(46.1)
(35.7)
100
0
-60
3QFY14 4QFY14 1QFY15 2QFY15 3QFY15 4QFY15 1QFY16 2QFY16
0
3QFY14 4QFY14 1QFY15 2QFY15 3QFY15 4QFY15 1QFY16 2QFY16
Net Sales
QoQ growth (%)
Source: Company, Angel Research
Source: Company, Angel Research
Improvement in operating margin boots operating profit
For the quarter, the company reported an improvement in the OPM by 265bp yoy
to 34%, primarily on account of lower employee, advertisement and other expenses.
Other expenses included provisions of ~`3cr on account of service tax.
Exhibit 4: Operating profit and margin trend
45
70.0
60.7
59.9
40
60.0
35
46.9
44.1
50.0
30
41.8
25
34.0
40.0
31.4
27.9
20
30.0
15
20.0
10
10.0
5
0
0.0
3QFY14 4QFY14 1QFY15 2QFY15 3QFY15 4QFY15 1QFY16 2QFY16
Operating Profit
Margin (%)
Source: Company, Angel Research
Higher PAT growth on back of strong operating performance
For the quarter, the company’s PAT grew by ~86% yoy to ~`12cr, on the back of
a strong operating performance and higher other income.
October 28, 2015
3
Wonderla Holidays | 2QFY2016 Result Update
Exhibit 5: Net Profit trend
30
28
25
25
20
15
13
12
12
10
7
6
7
5
0
3QFY14 4QFY14 1QFY15 2QFY15 3QFY15 4QFY15 1QFY16 2QFY16
Source: Company, Angel Research
Investment rationale
New amusement park at Hyderabad to boost footfalls: We expect
Wonderla Holidays to report a healthy growth in footfalls (~18% CAGR over
FY2015-17E) with it setting up a new amusement park in Hyderabad, which would
be operational in FY2017. The company also has plans to venture across other
parts of India to cater to a wider audience. In its first year of operation in
Hyderabad, we expect the company to achieve ~7 lakh footfalls with lower
utilisation of ~19%. Going forward, we expect the company to be able to report
strong footfalls growth on back of increase in utilisation. Further, we expect the
existing parks in Kochi and Bengaluru to post a ~4% CAGR over FY2015-17E.
Moreover, the company has a proven track record and is expected to consistently
increase its average realisation (realisation CAGR of ~10% over FY2009-15). The
company is expected to incur strong cash flows and achieve higher assets turnover
due to lower capex requirement, as most of the rides are manufactured at the in-
house plant.
Huge potential for F&B segment to grow: Apart from ticket sales, the
company also generates income from food and beverage (F&B) sales, and product
sales at its amusement parks, which contribute by almost 25% to the company’s
total revenue. As per a report by CARE Ratings, global amusement parks draw
60-65% of their revenues from other segments (non-ticket sales). Since FY2009,
the company’s revenue from other segments has increased from 15% to 25% and
we expect such contribution to rise further.
Company to benefit from higher occupancy rate at Wonderla
Resort and turnaround at the operating level: Over the last three
years, Wonderla Resort’s occupancy rate has increased significantly from ~30% to
~45%. Also, Wonderla Resort has turned around at the operating level in FY2015.
Increase in footfalls at the Bengaluru Park is likely to further boost growth for
Wonderla Resort. Moreover, we expect occupancy rate as well as profitability to
rise, going forward.
October 28, 2015
4
Wonderla Holidays | 2QFY2016 Result Update
Outlook and valuation
India’s young demographic profile and increasing discretionary spends are
expected to benefit the entertainment industry in the country. Also, the addition of
a new park in the company’s portfolio and expected increase in contribution from
other segments like F&B, resort, etc will drive growth for the company, going
forward. Further, the company has negative working capital and negligible debt
on its balance sheet. However, we believe that with the recent up move in the
stock, all the positives have been captured. Hence, we recommend a Neutral
rating on stock.
Company Background
Wonderla Holidays Ltd (Wonderla), founded in 2002, is one of the largest
amusement park operators in India. The company currently owns and operates
two amusement parks under the brand name ‘Wonderla’. The company also owns
and operates a resort besides an amusement park in Bengaluru under the brand
name ‘Wonderla Resort’, which has been operational since March
2012.
Wonderla is promoted by Mr Kochouseph Chittilappilly (promoter of V-Guard
Industries) and Mr Arun Kochouseph Chittilappilly.
The promoters of the company launched the first amusement park in Kochi in
2000 with the name ‘Veegaland’ and the second amusement park in Bengaluru in
2005 with the name Wonderla. Veega Holidays and Parks Pvt Ltd, which owned
and operated Veegaland, was merged with Wonderla Holidays Ltd with effect from
April 1, 2008. Consequently, both amusement parks are being operated under the
name Wonderla. Wonderla has a proven track record of managing amusement
parks with established brand equity. The company has been able to maintain high
standards of safety and hygiene, which has been able to attract organized visits
from schools, colleges and corporate segment.
October 28, 2015
5
Wonderla Holidays | 2QFY2016 Result Update
Profit and Loss Statement
Y/E March (` cr)
FY12
FY13
FY14
FY15
FY16E
FY17E
Total operating income
113
138
154
182
208
311
% chg
26.2
21.9
11.4
18.4
14.6
49.2
Total Expenditure
57
75
83
101
117
175
Personnel Expenses
21
22
24
27
32
48
Others Expenses
37
53
59
74
85
127
EBITDA
56
63
71
81
92
136
% chg
21.4
12.7
12.5
14.0
13.6
48.0
(% of Net Sales)
49.3
45.6
46.0
44.3
44.0
43.6
Depreciation& Amortisation
12
12
13
16
17
30
EBIT
44
51
57
64
74
105
% chg
29.6
15.4
12.7
12.1
15.3
41.7
(% of Net Sales)
39.1
37.0
37.4
35.4
35.6
33.8
Interest & other Charges
1
2
2
2
2
2
Other Income
1
2
2
10
15
4
(% of PBT)
3.1
3.0
4.1
14.0
17.1
3.3
Share in profit of Associates
-
-
-
-
-
-
Recurring PBT
44
50
58
73
88
107
% chg
4.4
12.6
15.7
26.0
20.2
22.1
Prior Period & Extraord. Exp./(Inc.)
-
-
-
-
-
-
PBT (reported)
44
50
58
73
88
107
Tax
14
16
18
22
28
34
(% of PBT)
32.4
32.9
31.1
30.6
32.0
32.0
PAT (reported)
30
34
40
51
60
73
Add: Share of earnings of asso.
-
-
-
-
-
-
Less: Minority interest (MI)
-
-
-
-
-
-
PAT after MI (reported)
30
34
40
51
60
73
ADJ. PAT
30
34
40
51
60
73
% chg
0.9
11.8
18.8
27.0
17.8
22.1
(% of Net Sales)
26.6
24.4
26.0
27.8
28.6
23.4
Basic EPS (`)
5.3
5.9
7.1
9.0
10.6
12.9
Fully Diluted EPS (`)
5.3
5.9
7.1
9.0
10.6
12.9
% chg
0.9
11.8
18.8
27.0
17.8
22.1
October 28, 2015
6
Wonderla Holidays | 2QFY2016 Result Update
Balance sheet
Y/E March (` cr)
FY12
FY13
FY14
FY15
FY16E
FY17E
SOURCES OF FUNDS
Equity Share Capital
42
42
42
57
57
57
Reserves& Surplus
52
78
108
300
323
361
Shareholders Funds
94
120
150
356
379
417
Total Loans
22
21
24
15
15
15
Deferred Tax Liability
3
5
4
-
-
-
Total Liabilities
120
145
178
372
394
433
APPLICATION OF FUNDS
Gross Block
208
242
255
270
290
490
Less: Acc. Depreciation
87
98
110
130
147
178
Net Block
121
144
145
139
142
312
Capital Work-in-Progress
4
6
20
40
180
-
Investments
-
-
-
194
14
14
Current Assets
14
16
35
23
72
126
Inventories
2
3
3
4
7
11
Sundry Debtors
0
0
0
1
1
1
Cash
2
3
20
8
25
37
Loans & Advances
1
3
4
10
21
40
Other Assets
8
8
7
0
19
37
Current liabilities
20
21
23
26
15
21
Net Current Assets
(6)
(5)
12
(3)
57
106
Deferred Tax Asset
-
1
1
1
1
1
Total Assets
120
145
178
372
394
433
October 28, 2015
7
Wonderla Holidays | 2QFY2016 Result Update
Cash Flow
Y/E March (` cr)
FY12
FY13
FY14
FY15
FY16E FY17E
Profit before tax
44
50
58
73
88
107
Depreciation
12
12
13
16
17
30
Change in Working Capital
2
(0)
(2)
(2)
(43)
(37)
Interest / Dividend (Net)
1
2
1
(6)
2
2
Direct taxes paid
(14)
(15)
(20)
(25)
(28)
(34)
Others
-
0
0
1
-
-
Cash Flow from Operations
45
49
50
56
35
68
(Inc.)/ Dec. in Fixed Assets
(39)
(37)
(26)
(29)
(185)
(40)
(Inc.)/ Dec. in Investments
-
-
-
(194)
180
-
Cash Flow from Investing
(39)
(37)
(26)
(223)
(5)
(40)
Issue of Equity
-
-
-
170
-
-
Inc./(Dec.) in loans
5
(2)
3
(3)
-
-
Dividend Paid (Incl. Tax)
(7)
(7)
(7)
(10)
(12)
(15)
Interest / Dividend (Net)
(1)
(2)
(3)
(2)
(2)
(2)
Cash Flow from Financing
(4)
(11)
(7)
156
(13)
(16)
Inc./(Dec.) in Cash
2
0
17
(12)
17
11
Opening Cash balances
(0)
2
2
19
8
25
Closing Cash balances
2
2
19
8
25
37
October 28, 2015
8
Wonderla Holidays | 2QFY2016 Result Update
Key ratios
Y/E March
FY12
FY13
FY14
FY15
FY16E
FY17E
Valuation Ratio (x)
P/E (on FDEPS)
59.2
53.0
44.6
35.1
29.8
24.4
P/CEPS
42.8
39.2
33.5
26.6
23.1
17.2
P/BV
19.0
14.8
11.9
5.0
4.7
4.3
Dividend yield (%)
2.0
2.0
2.7
2.7
3.8
4.6
EV/Sales
15.9
13.0
11.6
8.8
8.4
5.6
EV/EBITDA
32.3
28.6
25.2
19.8
19.2
12.9
EV / Total Assets
12.9
10.8
8.9
4.0
4.3
3.8
Per Share Data (`)
EPS (Basic)
5.3
5.9
7.1
9.0
10.6
12.9
EPS (fully diluted)
5.3
5.9
7.1
9.0
10.6
12.9
Cash EPS
7.4
8.0
9.4
11.8
13.6
18.3
DPS
6.3
6.3
8.5
8.5
11.9
14.6
Book Value
16.6
21.2
26.5
63.1
67.1
73.9
Returns (%)
RoCE
38.0
36.2
33.1
17.3
18.8
24.3
Angel RoIC (Pre-tax)
38.8
36.9
37.4
38.1
20.9
27.5
RoE
32.0
28.0
26.6
14.2
15.7
17.5
Turnover ratios (x)
Asset Turnover
0.5
0.6
0.6
0.7
0.7
0.6
Inventory / Sales (days)
6
7
8
8
12
13
Receivables (days)
1
1
1
1
1
1
Payables (days)
12
13
10
7
8
7
Net WC (days)
(5)
(4)
(1)
2
5
7
October 28, 2015
9
Wonderla Holidays | 2QFY2016 Result Update
Research Team Tel: 022 - 39357800
DISCLAIMER
Angel Broking Private Limited (hereinafter referred to as “Angel”) is a registered Member of National Stock Exchange of India Limited,
Bombay Stock Exchange Limited and Metropolitan Stock Exchange of India Limited.. It is also registered as a Depository Participant
with CDSL and Portfolio Manager with SEBI. It also has registration with AMFI as a Mutual Fund Distributor. Angel Broking Private
Limited is a registered entity with SEBI for Research Analyst in terms of SEBI (Research Analyst) Regulations, 2014 vide registration
number INH000000164. Angel or its associates has not been debarred/ suspended by SEBI or any other regulatory authority for
accessing /dealing in securities Market. Angel or its associates including its relatives/analyst do not hold any financial
interest/beneficial ownership of more than 1% in the company covered by Analyst. Angel or its associates/analyst has not received any
compensation / managed or co-managed public offering of securities of the company covered by Analyst during the past twelve
months. Angel/analyst has not served as an officer, director or employee of company covered by Analyst and has not been engaged in
market making activity of the company covered by Analyst.
This document is solely for the personal information of the recipient, and must not be singularly used as the basis of any investment
decision. Nothing in this document should be construed as investment or financial advice. Each recipient of this document should
make such investigations as they deem necessary to arrive at an independent evaluation of an investment in the securities of the
companies referred to in this document (including the merits and risks involved), and should consult their own advisors to determine
the merits and risks of such an investment.
Reports based on technical and derivative analysis center on studying charts of a stock's price movement, outstanding positions and
trading volume, as opposed to focusing on a company's fundamentals and, as such, may not match with a report on a company's
fundamentals.
The information in this document has been printed on the basis of publicly available information, internal data and other reliable
sources believed to be true, but we do not represent that it is accurate or complete and it should not be relied on as such, as this
document is for general guidance only. Angel Broking Pvt. Limited or any of its affiliates/ group companies shall not be in any way
responsible for any loss or damage that may arise to any person from any inadvertent error in the information contained in this report.
Angel Broking Pvt. Limited has not independently verified all the information contained within this document. Accordingly, we cannot
testify, nor make any representation or warranty, express or implied, to the accuracy, contents or data contained within this document.
While Angel Broking Pvt. Limited endeavors to update on a reasonable basis the information discussed in this material, there may be
regulatory, compliance, or other reasons that prevent us from doing so.
This document is being supplied to you solely for your information, and its contents, information or data may not be reproduced,
redistributed or passed on, directly or indirectly.
Neither Angel Broking Pvt. Limited, nor its directors, employees or affiliates shall be liable for any loss or damage that may arise from
or in connection with the use of this information.
Note: Please refer to the important ‘Stock Holding Disclosure' report on the Angel website (Research Section). Also, please refer to the
latest update on respective stocks for the disclosure status in respect of those stocks. Angel Broking Pvt. Limited and its affiliates may
have investment positions in the stocks recommended in this report.
Disclosure of Interest Statement
Wonderla Holidays
1. Analyst ownership of the stock
No
2. Angel and its Group companies ownership of the stock
No
3. Angel and its Group companies' Directors ownership of the stock
No
4. Broking relationship with company covered
No
Note: We have not considered any Exposure below ` 1 lakh for Angel, its Group companies and Directors
Ratings (Based on expected returns
Buy (> 15%)
Accumulate (5% to 15%)
Neutral (-5 to 5%)
over 12 months investment period):
Reduce (-5% to -15%)
Sell (< -15%)
October 28, 2015
10